Question 13
Exhibit.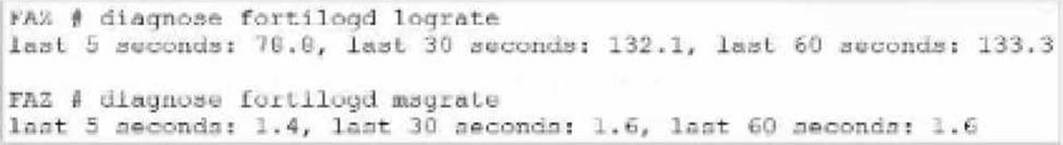
What can you conclude about the output?
Correct Answer:A
In this output, we see two diagnostic commands executed on a FortiAnalyzer device:
diagnose fortilogd lograte: This command shows the rate at which logs are being processed by the FortiAnalyzer in terms of log entries per second.
diagnose fortilogd msgrate: This command displays the message rate, or the rate at which individual messages are being processed.
The values provided in the exhibit output show:
Log rate (lograte): Consistently high, showing values such as 70.0, 132.1, and 133.3 logs per second over different time intervals.
Message rate (msgrate): Lower values, around 1.4 to 1.6 messages per second. Explanation
Interpretation of log rate vs. message rate: In FortiAnalyzer, the log rate typically refers to the rate of logs being stored or indexed, while the message rate refers to individual messages within these logs. Given that a single log entry can contain multiple messages, it's common to see a lower message rate relative to the log rate.
Understanding normal operation: In this case, the message rate being lower than the log rate is expected and typical behavior. This discrepancy can arise because each log entry may bundle multiple related messages, reducing the message rate relative to the log rate.
Conclusion
Correct Answer A. The message rate being lower than the log rate is normal.
This aligns with thenormal operational behavior of FortiAnalyzer in processing logs and messages.
There is no indication that both logs and messages are nearly finished indexing, as that would typically show diminishing rates toward zero, which is not the case here. Additionally, there's no information in this output about specific ADOMs or a comparison between traffic logs and event logs. Thus, options B, C, and D are incorrect.
[References:, FortiOS 7.4.1 and FortiAnalyzer 7.4.1 command guides for diagnose fortilogd lograte and diagnose fortilogd msgrate., ]
Question 14
Which two statements about FortiAnalyzer Fabric deployments are true? (Choose two answers)
Correct Answer:BC
From Exact Extract of knowledge of FortiAnalyzer 7.6 Study guide documents:
B is true (members operate in analyzer mode, not collector mode): The study guide defines Fabric members as FortiAnalyzer devices that ''retain access to the features described in the FortiAnalyzer Administration Guide'' and that ''each member can create or raise incidents and events.'' In contrast, it states that a FortiAnalyzer operating in collector mode ''does not provide capabilities for event management or reporting,'' and also notes that ''in collector mode, the GUI doesn't include FortiView, Reports, or Incidents & Events.'' Since Fabric members must be able to generate/manage incidents and events, they must be operating with analyzer capabilities rather than collector-only functionality.
C is true (members do not forward their logs to the supervisor): The supervisor provides centralized visibility, but the study guide describes the supervisor's log access as viewing logs collected on members, not receiving/storing forwarded log files. It states: ''In the FortiAnalyzer Fabric supervisor, Log View displays logs collected on all FortiAnalyzer Fabric members,'' and clarifies ''the logs contain the same information as displayed in the host FortiAnalyzer device they were collected on.'' This indicates the logs remain on the member (host) and are made visible to the supervisor for centralized monitoring rather than being forwarded and stored on the supervisor.
For completeness, the study guide also explicitly states ''HA is not available on the supervisor'' (so A is false) and members do not need the same time zone as the supervisor (so D is false).
Question 15
You mustfind a specific security event log in the FortiAnalyzer logs displayed in FortiView, but, so far, you have been uncuccessful.
Which two tasks should you perform to investigate why you are having this issue? (Choose two.)
Correct Answer:AB
Question 16
Which log will generate an event with the status Contained?
Correct Answer:A
Question 17
What is the purpose of running the command diagnose sql status sqlreportd?
Correct Answer:C
The command diagnose sql statussqlreportd is used in FortiAnalyzer to obtain specific information about the SQL reporting process and caching status. Here??s what this command accomplishes and an analysis of each option:
Command Functionality:
sqlreportd is the FortiAnalyzer daemon responsible for managing SQL-based reporting processes.
The diagnose sql status sqlreportd command provides information on active SQL query connections and thehcache(historical cache) status, which helps in monitoring and troubleshooting SQL report generation.
Option Analysis:
Option A - To View a List of Scheduled Reports:
This option is incorrect because the command does not list scheduled reports. Instead, it focuses on SQL reporting processes and cache details.
Option B - To List the Current SQL Processes Running:
While the command may show active SQL connections, its primary focus is not a detailed list of all SQL processes but rather the connections and cache status for reporting.
Option C - To Display the SQL Query Connections and hcache Status:
This is correct. The command specifically provides information on SQL query connections related to the reporting process (sqlreportd) and displays thehcachestatus.
Option D - To Identify the Database Log Insertion Status:
This is incorrect. The command does not provide details on log insertion status. Log insertion status is typically monitored through different diagnostic commands focused on database processes and log handling.
Conclusion:
Correct Answer C. To display the SQL query connections and hcache status
This command is used to monitor SQL reporting activities and cache status, aiding in the analysis of report generation performance and connection health.
[References:, FortiAnalyzer 7.4.1 documentation on SQL diagnostic commands, particularly those related to reporting (sqlreportd) and caching mechanisms., , ]
Question 18
You find that as part of your role as an analyst, you frequently search log View using the same parameters. Instead of defining your search filters repeatedly, what can you do to save time?
Correct Answer:B
When you frequently use the same search parameters in FortiAnalyzer??s Log View, setting up a reusable filter or view can saveconsiderable time. Here??s an analysis of each option:
* Option A - Configure a Custom Dashboard:
* Custom dashboards are useful for displaying a variety of widgets and summaries on network activity, performance, and threat data, but they are not designed for storing specific search filters for log views.
* Conclusion:Incorrect.
* Option B - Configure a Custom View:
* Custom views in FortiAnalyzer allow analysts to save specific search filters and configurations.
By setting up a custom view, you can retain your frequently used search parameters and quickly access them without needing to reapply filters each time. This option is specifically designed to streamline the process of recurring log searches.
* Conclusion:Correct.
* Option C - Configure a Data Selector:
* Data selectors are used to define specific types of data for FortiAnalyzer reports and widgets.
They are useful in reports but are not meant for saving and reusing log search parameters in Log View.
* Conclusion:Incorrect.
* Option D - Configure a Macro and Apply It to Device Groups:
* Macros in FortiAnalyzer are generally used for automation tasks, not for saving log search filters.
Applying macros to device groups does not fulfill the requirement of saving specific log view search parameters.
* Conclusion:Incorrect.
Conclusion:
* Correct Answer B. Configure a custom view.
Custom views allow you to save specific search filters, enabling quick access to frequently used parameters in Log View.
References:
FortiAnalyzer 7.4.1 documentation on creating and using custom views for log searches.