Online FCP_FAZ_AN-7.6 Practice TestMore Fortinet Products >
Free Fortinet FCP_FAZ_AN-7.6 Exam Dumps Questions
Fortinet FCP_FAZ_AN-7.6: Fortinet NSE 5 - FortiAnalyzer 7.6 Analyst
- Get instant access to FCP_FAZ_AN-7.6 practice exam questions
- Get ready to pass the Fortinet NSE 5 - FortiAnalyzer 7.6 Analyst exam right now using our Fortinet FCP_FAZ_AN-7.6 exam package, which includes Fortinet FCP_FAZ_AN-7.6 practice test plus an Fortinet FCP_FAZ_AN-7.6 Exam Simulator.
- The best online FCP_FAZ_AN-7.6 exam study material and preparation tool is here.
Question 1
After generating a report, you notice the information you where expecting to see is not included in it. However, you confirm that the logs are there.
Which two actions should you perform? (Choose two.)
Correct Answer:AD
When a generated report does not contain the expected information even though the logs are confirmed to be present, it typically indicates anissue with the report's configuration. There are a few common reasons this might happen:
Option A - Check the Time Frame Covered by the Report:
Reports are generated based on a specific time frame. If the report's time frame does not cover the period when the relevant logs were collected, those logs won??t appear in the report output. Verifying and adjusting the time frame is essential to ensure the report includes all relevant data.
Conclusion:Correct.
Option B - Disable Auto-Cache:
Auto-cache is designed to improve report generation speed by using cached data. Disabling auto-cache would typically only be relevant if the report is pulling outdated data from cache, but it doesn??t directly affect whether specific logs are included in a report.
Conclusion:Incorrect.
Option C - Increase the Report Utilization Quota:
The report utilization quota is related to the resource limits for generating reports. It does not directly influence whether certain data appears in a report. Increasing this quota would help only if there are resource issues preventing the report from completing, not if specific logs are missing from the report.
Conclusion:Incorrect.
Option D - Test the Dataset:
Datasets determine which logs and data fields are pulled into the report. If a dataset is configured incorrectly or does not include the required log fields, it could lead to missing information. Testing the dataset allows you to verify that it??s correctly configured and pulling the expected data.
Conclusion:Correct.
Conclusion:
Correct Answer:A. Check the time frame covered by the reportandD. Test the dataset.
These steps directly address the issues that could lead to missing information in a report when logs are available but not displayed.
[References:, FortiAnalyzer 7.4.1 documentation on report generation settings, time frames, and dataset configuration for accurate report results., ]
Question 2
Refer to the exhibit with partial output: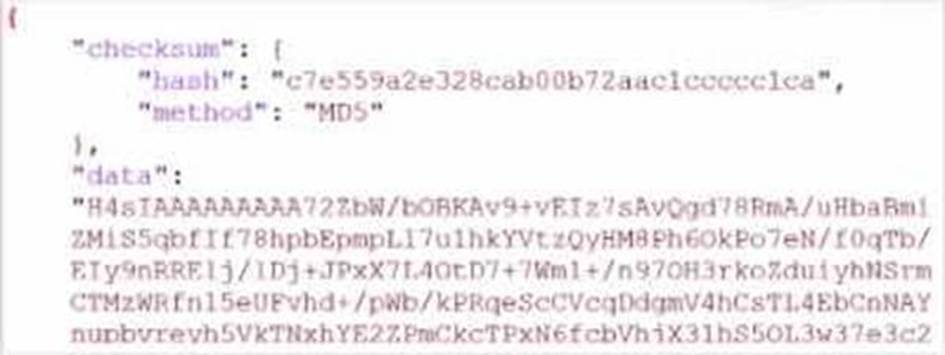
Your colleague exported a playbook and has sent it to you for review. You open the file in a text editor and observer the output as shown in the exhibit.
Which statement about the export is true?
Correct Answer:A
In the exhibit, the data structure shows a checksum field and a data field with a long, seemingly encoded string. This format is indicative of a file that has been compressed or encoded for storage and transfer.
Export Data Type:
The data field is likely a base64-encoded string, which is commonly used to represent binary data in text format. Base64 encoding is often applied to data that has been compressed (zipped) for easier handling and transfer. The checksum field, with an MD5 hash, provides a way to verify the integrity of the data after decompression.
Option Analysis:
* A. The export data type is zipped: Correct. The compressed and encoded format of the data suggests that the export is in a zipped format, allowing for efficient storage and transfer.
* B. The playbook is misconfigured: There is no indication of misconfiguration in this exhibit. The presence of the checksum and data fields aligns with standard export practices.
* C. The option to include the connector was not selected: There is no evidence in the output to conclude that connectors are missing. Connectors are typically listed separately and would not directly affect the checksum and encoded data structure.
* D. Your colleague put a password on the export: There??s no indication of password protection in the exhibit. Password protection would likely alter the data structure, and there would be some mention of encryption.
Conclusion:
Correct Answer:A. The export data type is zipped.
This answer is consistent with the typical use of base64 encoding for compressed (zipped) data exports in FortiAnalyzer.
[References:, FortiAnalyzer 7.4.1 documentation on exporting playbooks and data compression methods., ]
Question 3
Which statement about exporting items in Report Definitions is true?
Correct Answer:C
Question 4
You created a playbook on FortiAnalyzer that uses a FortiOS connector. When configuring the FortiGate side, which type of trigger must be used so that the actions in an automation stich are available in the FortiOS connector?
Correct Answer:D
When using FortiAnalyzer to create playbooks that interact with FortiOS devices, an Incoming Webhook trigger is required on the FortiGate side to make the actions in an automation stitch accessible through the FortiOS connector. The incoming webhook trigger allows FortiAnalyzer to initiate actions on FortiGate by sending HTTP POST requests to specified endpoints, which in turn trigger automation stitches defined on the FortiGate.
Here's an analysis of each option:
Option A: FortiAnalyzer Event Handler
This is incorrect. The FortiAnalyzer Event Handler is used within FortiAnalyzer itself for handling log events and alerts, but it does not trigger automation stitches on FortiGate.
Option B: Fabric Connector event
This is incorrect. Fabric Connector events are related to Fortinet's Security Fabric integrations but are not specifically used to trigger FortiGate automation stitches from FortiAnalyzer.
Option C: FortiOS Event Log
This is incorrect. While FortiOS event logs can be used for monitoring, they are not designed to trigger automation stitches directly from FortiAnalyzer.
Option D: Incoming webhook
This is correct. The Incoming Webhook trigger on FortiGate enables it to receive requests from FortiAnalyzer, allowing playbooks to activate automation stitches defined on the FortiGate device. This method is commonly used to integrate actions from FortiAnalyzer to FortiGate via the FortiOS connector.
Reference: According to FortiOS and FortiAnalyzer documentation, when integrating FortiAnalyzer
playbooks with FortiGate automation stitches, the recommended trigger type on FortiGate is an Incoming Webhook, allowing FortiAnalyzer to interact with FortiGate??s automation framework through the FortiOS connector.
Question 5
Refer to the exhibit.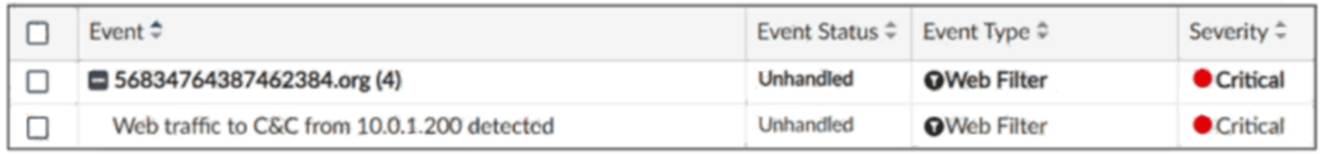
Which statement about the displayed event is correct? (Choose one answer))
Correct Answer:D
Comprehensive and Detailed Explanation: From Exact Extract of knowledge of FortiAnalyzer 7.6 Study guide documents:
In the exhibit, theEvent Statusshown isUnhandled(Event Type: Web Filter; Severity: Critical). The FortiAnalyzer study guide definesUnhandledevents as events whose security risk has not been addressed and is therefore still active/open. Specifically, it states:??Unhandled: The security risk is considered open.??
This directly matches optionD.
The other options correspond to different statuses or actions:
* Isolated/Containedapplies when the risk source is isolated (statusContained), notUnhandled.
* Escalatedrefers to events moved/raised for further action (statusEscalated), notUnhandled.
* Whether an incident was created cannot be concluded solely from the status ??Unhandled?? in the exhibit; the study guide ties incident creation to incident management workflows rather than equating ??Unhandled?? with an incident being created.
Question 6
What is the purpose of using data selectors when configuring event handlers?
Correct Answer:C